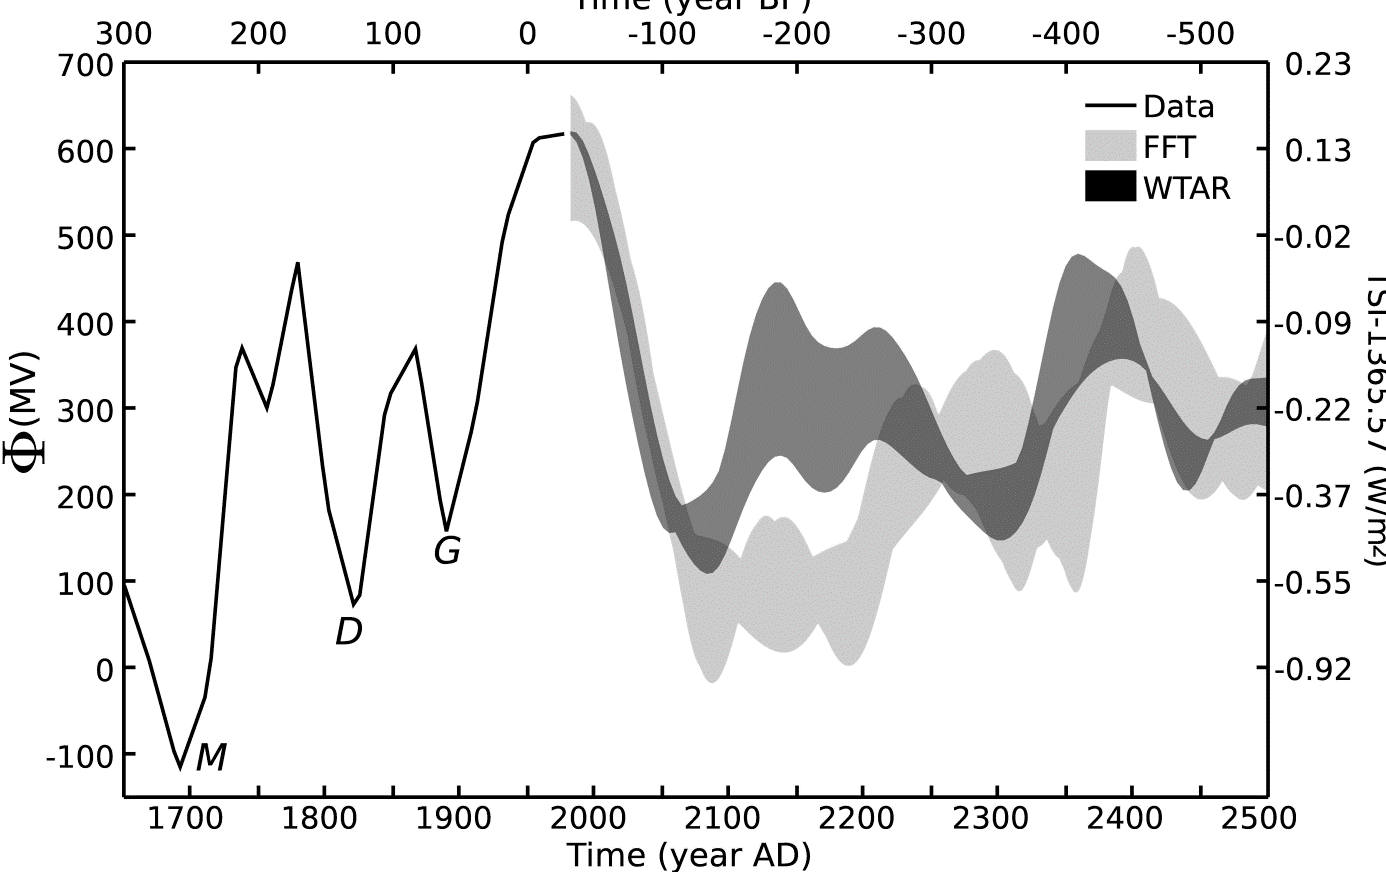
A new paper published in the Journal of Geophysical Research: Space Research shows solar activity peaked at the end of the 20th century, but predicts a strong decrease in solar activity until around 2100 AD to low levels similar to the Dalton Minimum.
Prediction of solar activity for the next 500 years
Friedhelm Steinhilber, Jürg Beer
Abstract: Recently a new low-noise record of solar activity has been reconstructed for the past 9.400 years by combining two 10 Be records from Greenland and Antarctica with 14 C from tree rings [F. Steinhilber et al., 2012]. This record confirms earlier results, namely that the Sun has varied with distinct periodicities in the past. We present a prediction of mean solar magnetic activity averaged over 22 years for the next 500 years mainly based on the spectral information derived from the record of the past solar activity. Assuming that the Sun will continue varying with the same periodicities for the next centuries we extract the spectral information from the past and apply it in two different methods to predict the future of solar magnetic activity. First, the two methods are tested by predicting past changes. Our methods are able to predict periods of high and low solar activity for a few centuries in the past. However, they are less successful in predicting the correct amplitude. Then, the methods were used to predict the period 2000-2500. Both methods predict a period of low activity around 2100 AD. Between 2100 AD and 2350 AD the results are inconsistent regarding the duration of the low activity state in 2100 AD and the level of activity until 2250 AD. Around 2250 AD both methods predict a period of moderate activity. After 2350 AD both methods point to a period of high activity. The period of high activity will end around 2400 AD and will be followed by a period of moderate activity.
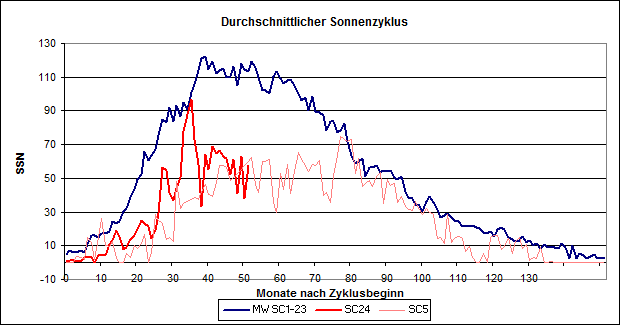
However, as shown by the graph below, the current solar cycle [SC 24, red] is already closely tracking the first solar cycle [SC 5, pink] of the Dalton Minimum, and both are quite weak in comparison to the average of solar cycles 1 through 23 [blue].

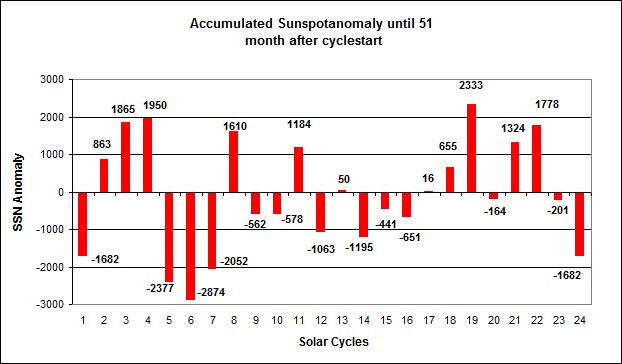
The accumulated sunspot anomaly has significantly declined during the current solar cycle:


http://translate.googleusercontent.com/translate_c?depth=1&rurl=translate.google.com&sl=de&tl=en&u=http://iopscience.iop.org/1748-9326/5/2/024001/fulltext/&usg=ALkJrhi_HqyQWw5nXjxD4qrhTzJV7vp4iw
ReplyDeletesee also
ReplyDeletehttp://ccsenet.org/journal/index.php/apr/article/view/14754/10140
Nice work. With the AMO and PDO coincidentally turning down for the next 30 years we're in for at least another degree celcius of global cooling. That will really put the cat amongst the CAGW pigeons.
ReplyDeleteMy model is shaping up quite well too, especially recently, although at the moment it is running a few years in advance of the temperature record for some reason. Possibly because the ocean cycles are only quasi-periodic. It uses the previous solar cycle length - temperature correlation, so Steinhilber & Beer's paper suggests the solar component will keep falling as well as the ocean component. Doubly cooling.
Thanks & you might be interested in this very simple model of the "sunspot integral" + PDO + AMO:
Deletehttp://hockeyschtick.blogspot.com/2010/01/climate-modeling-ocean-oscillations.html
I saw that MS - very good indeed! The SSN integral is probably picking up the same solar dynamo process that solar cycle length does. I'd be interested how it'd go with the CET, which is a very long dataset. I should really extend mine back to 1659 if I exert myself. I haven't before now because the solar cycle lengths in the Maunder are uncertain, although I've recently seen data which makes me think I can do it.
DeleteMy point with this type of modelling is you will do much much better if you include all of the significant variables (in the statistical sense). The IPCC ensemble models leave out solar magnetic and ocean cycles, so inevitably their inferred values of climate sensitivity are too high. On my model when I calculated 2XCO2 by difference it came out at 0.7 C/doubling - ie same as Lindzen.
Thanks & let me know if you extend your analysis
DeleteThanks Michael, I've reblogged this entry, I hope that's ok.
ReplyDeleteBy the way, my own sst model using integrated sunspot number is here. R^2=0.9 but this is for monthly data, so less degrees of freedom than your running average.
http://tallbloke.wordpress.com/2013/04/16/letter-to-sir-mark-walport-putting-a-question-to-the-governments-sci-tech-committee/
Yes please feel free to reblog any of my posts & thanks for your support. I'm also a big fan of your blog.
DeleteWhat if the periods of activity are a result of rising and declining of plantary orbits in relation to the sun's equatorial plain. The sun give the appearance of a vertical ascent and descent as our earth moves above and below the sun's equatorial plain. This movement account for annual seasonal changes. What if a similiar phenomenon is occuring with the earths orbit moving in a vertical ascent and descent against the sun equatorial plain. As the earth ascends the solar equatorial plain one might expect its orbital to become more elipical reducing the gravitational attraction and causing a reduction in solar activity. Meanwhile as the earth's orbit descents against the solar equator its orbit becomes more circular in nature and the gravitational attraction increases, boosting solar active. However unlike the annual ascent and descent of the sun across the surface of the earth. This rising and falling of the earth across the surface of the sun may have an extend period of possibly a century or more. As with the earth so with the other planets in our solar system.
ReplyDelete